


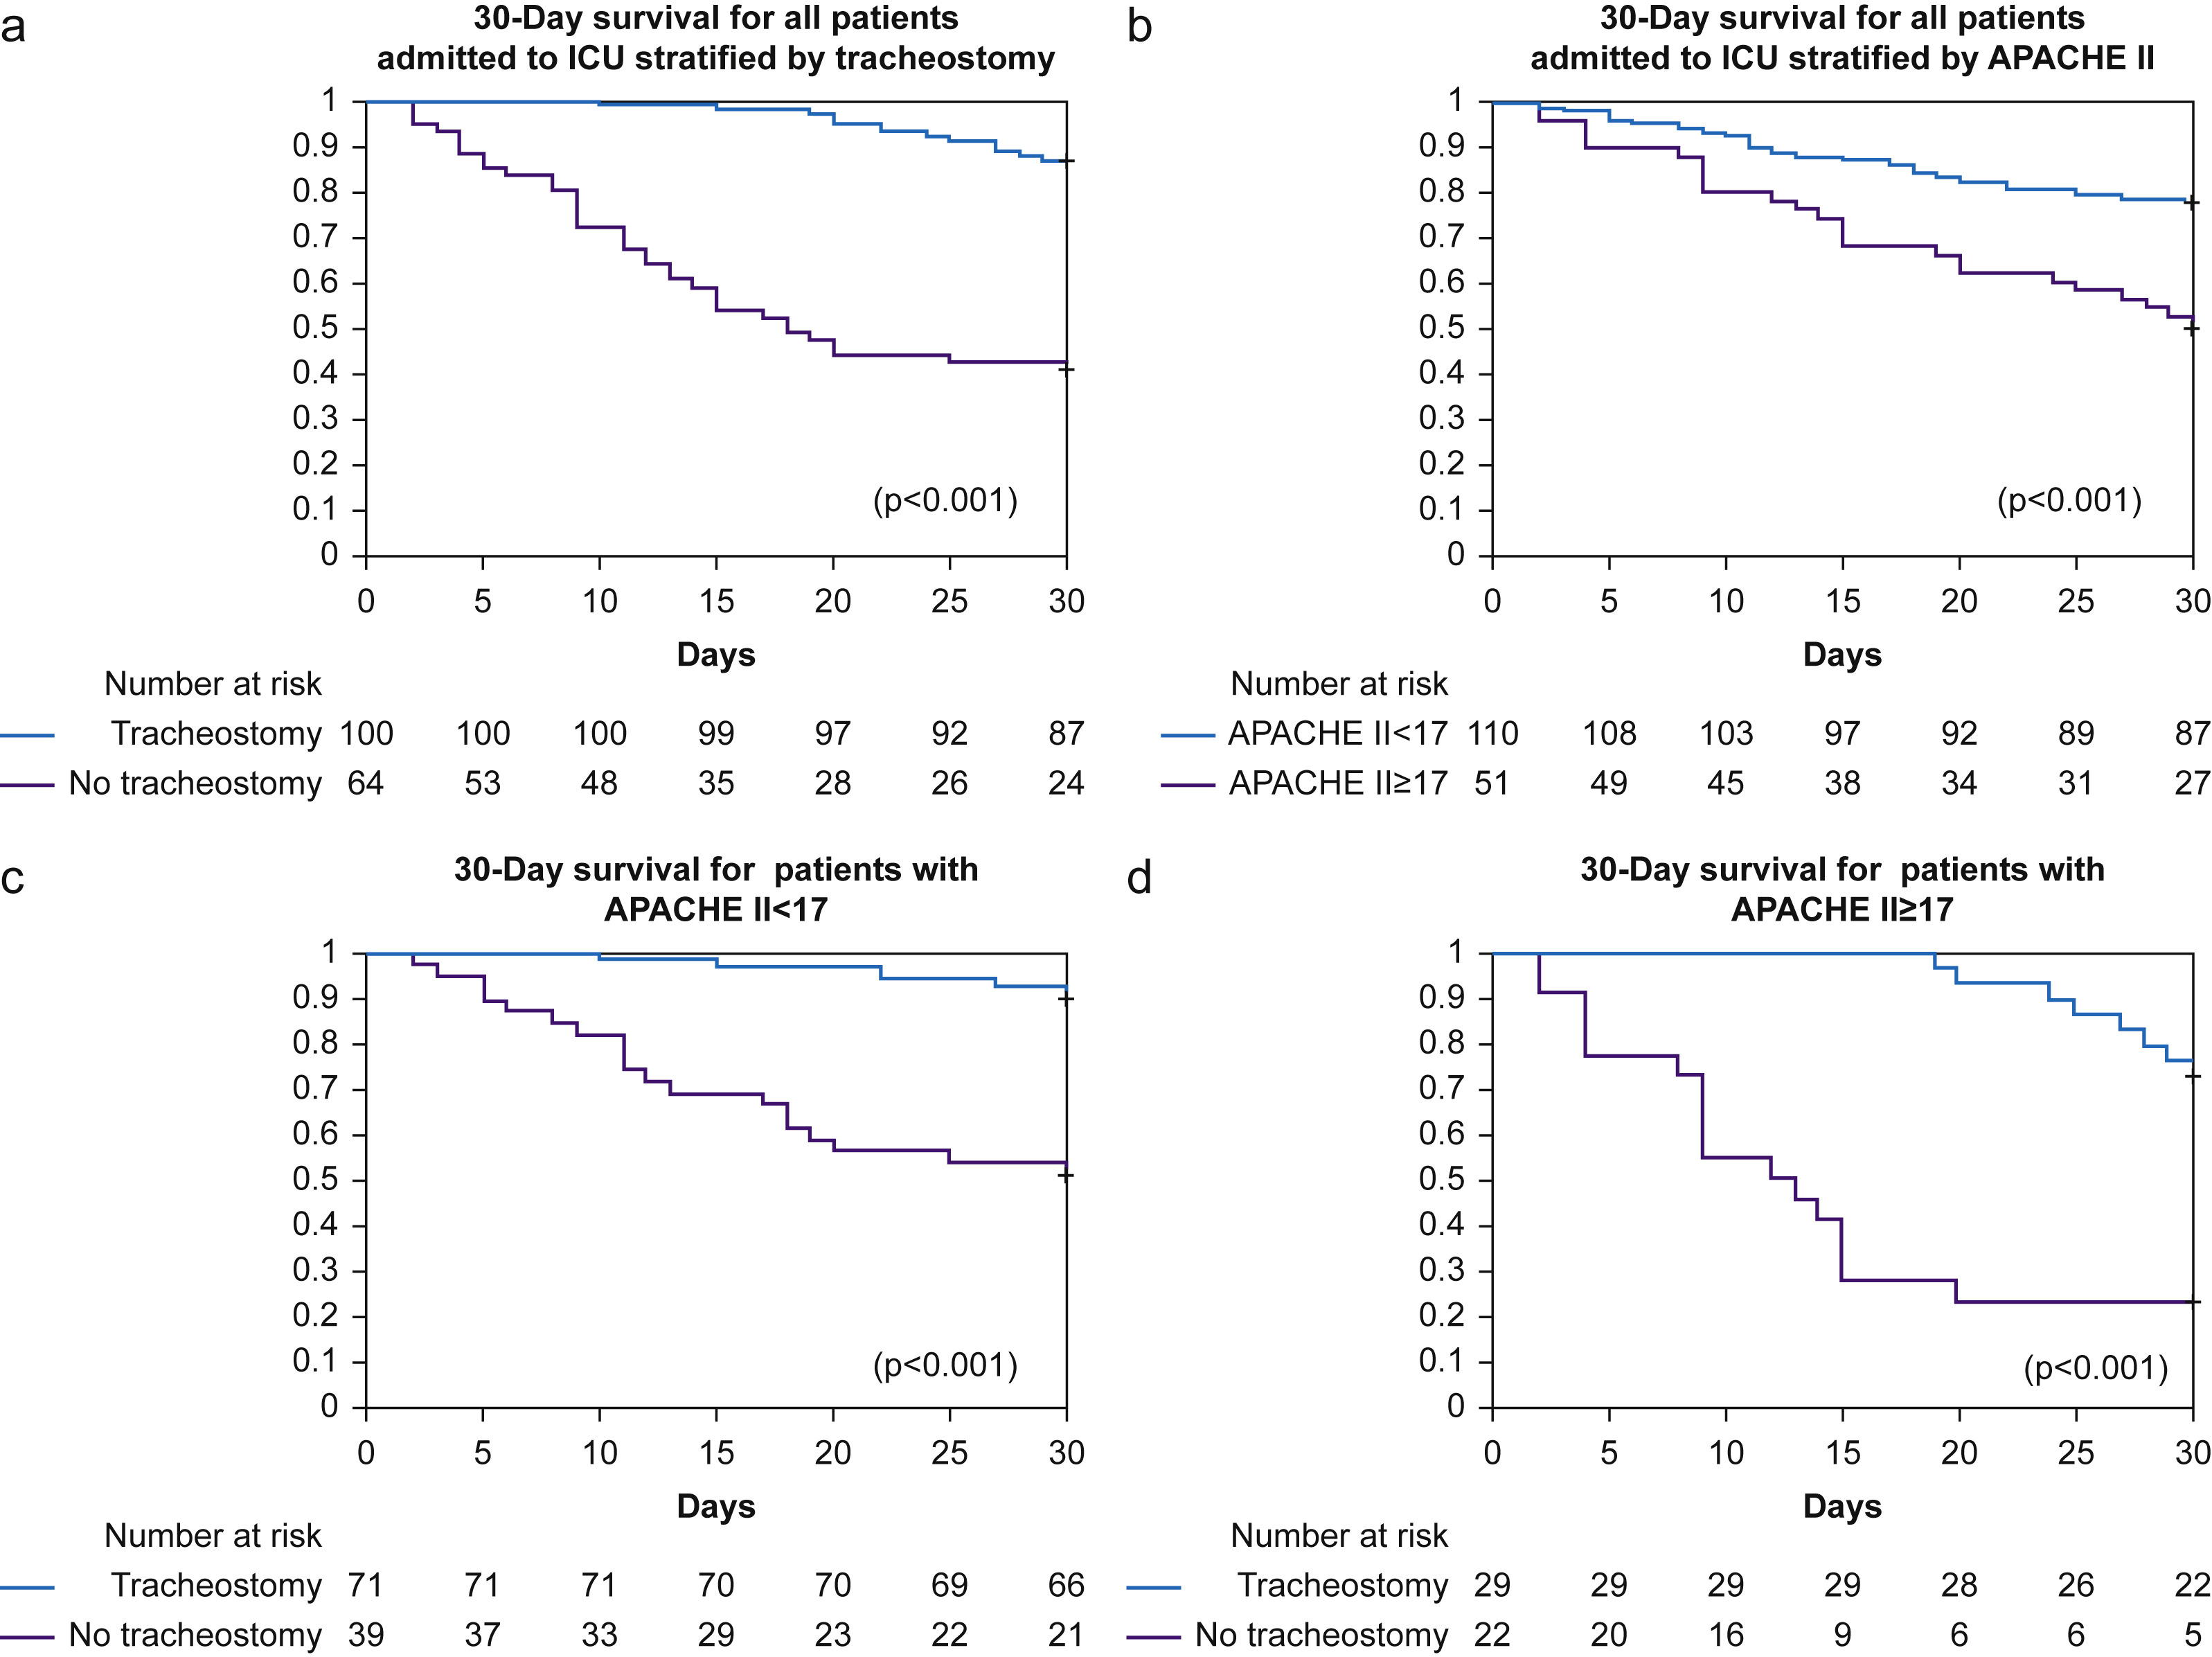
Fig 1Kaplan–Meier plot for 30-day survival from date of intubation. Number at risk detailed below chart. (a) All patients stratified by tracheostomy. (b) All patients stratified by APACHE II score. (c) All patients with APACHE II score<17, stratified by tracheostomy. (d) All patients with APACHE II score ≥17, stratified by tracheostomy. P<0.05 used for significance as calculated by the log rank test. APACHE, Acute Physiology and Chronic Health; ICU, Intensive Care Unit.