


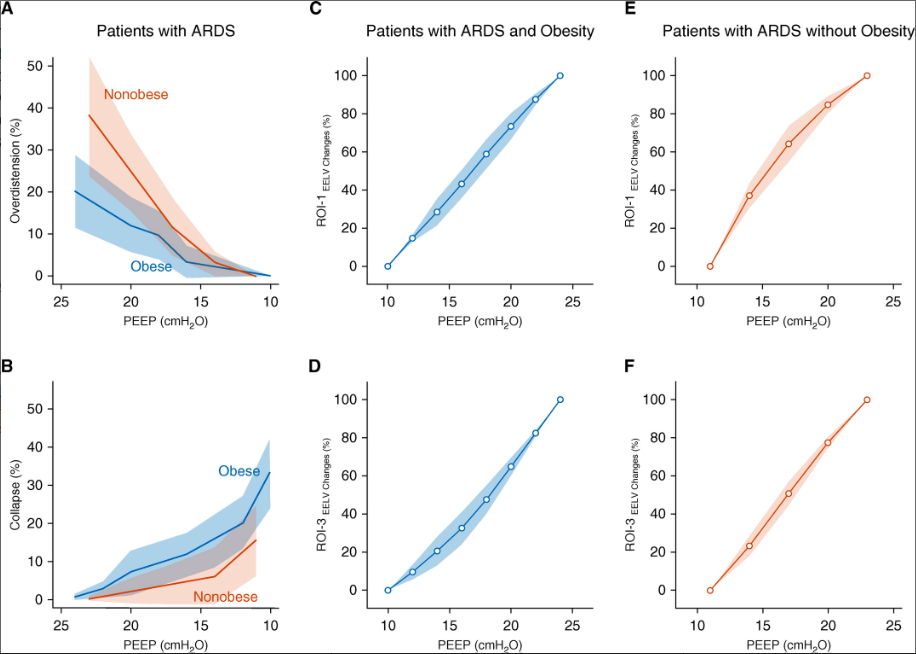
Clinical study of patients with acute respiratory distress syndrome (ARDS) and class III obesity versus patients with ARDS without obesity. Overdistension and collapse during a similar sequence of positive end-expiratory pressure (PEEP) and regional pressure–volume (P–V) curves for the most nondependent and the most dependent regions of interest (ROIs) are shown. (A) Overdistension and (B) collapse measured by using electrical impedance tomography in patients with ARDS and class III obesity versus patients with ARDS without obesity are shown. A mixed linear model was used for overdistension (P = 0.002 for interaction) and collapse (P < 0.001 for interaction), and for similar PEEP, overdistension was higher in patients with ARDS and without obesity and collapse was higher in patients with ARDS and class III obesity. Regional P–V curves were built for the most non–gravity-dependent ROI (ROI-1) and the most dependent ROI (ROI-3) (see Figure E1). The regional variations in EELV were calculated by using electrical impedance tomography for each PEEP (see online supplement). ROI-1 are shown in (C) patients with ARDS and class III obesity and in (E) patients with ARDS without obesity. Of note, for similar PEEP values, the P–V curve shape was different: in patients with ARDS and class III obesity, it was linear, and in patients with ARDS and without obesity, it showed positive exponential growth (mixed linear model, P = 0.002 for interaction). ROI-3 are shown in (D) patients with ARDS and class III obesity and in (F) patients with ARDS without obesity. Again, for similar PEEPs, P–V curve shapes were different. In patient with ARDS and class III obesity, the curve showed exponential negative decay, whereas in patients with ARDS without obesity, it was linear (mixed linear model, P = 0.001 for interaction). Data are presented as the mean ± SD (confidence interval). EELV = end-expiratory lung volume.